

Amanda Yap
August 12, 2025
As some terminology in reports do change, we maintain previously posted reports and datasets as originally approved and published.
The Office of Homeland Security Statistics (OHSS) produces Annual Flow Reports describing the movement of people into different immigration statuses. The 2024 Refugees Annual Flow Report includes the number and characteristics of people admitted to the United States as refugees in Fiscal Year 2024.[1] Data come from the U.S. Department of State (DOS), as described in the Data Source.
Refugee Admissions Ceiling
The President consults with Congress to set an annual refugee admissions ceiling under the Immigration and Nationality Act (INA).[5] The lowest ceiling level was 15,000 for 2021 and the highest ceiling was 133,000 in 1993. The ceiling has been at 125,000 for fiscal years 2022 through 2024.[6]
On September 29, 2023, President Biden issued the Presidential Determination on Refugee Admissions for Fiscal Year 2024 (PD 2023-13). This determination continued a refugee ceiling of 125,000 for 2024 (Table 1) and allowed individuals from the following locations to be considered for in-country processing:[7]
- Cuba
- Eurasia
- Baltic States
- Iraq
- Honduras
- Guatemala
- El Salvador
The memorandum also provided that, in certain circumstances, persons identified by a U.S. Embassy in any location are also eligible for in-country processing.
Refugee admissions reached 80% of the designated ceiling in 2024.
Latin America/Caribbean refugees quadrupled from 6,320 in 2023 to 25,360 in 2024 (Table 1). The ceiling limit for Latin America/Caribbean increased to 50,000 to address worsening conditions in the region.
Table 1.
Proposed and Actual Refugee Admissions by Region of Chargeability: Fiscal Years 2022 to 2024
| Region | 2022 Ceiling | 2022 Admissions | 2023 Ceiling | 2023 Admissions | 2024 Ceiling | 2024 Admissions |
|---|---|---|---|---|---|---|
| Total | 125,000 | 25,520 | 125,000 | 60,050 | 125,000 | 100,060 |
| Africa | 40,000 | 11,390 | 40,000 | 24,510 | 50,000 | 34,030 |
| East Asia | 15,000 | 2,220 | 15,000 | 6,260 | 20,000 | 7,540 |
| Europe/Central Asia | 10,000 | 2,350 | 15,000 | 2,770 | 3,000 | 3,180 |
| Latin America/Caribbean | 15,000 | 2,490 | 15,000 | 6,320 | 50,000 | 25,360 |
| Near East/South Asia | 35,000 | 7,080 | 35,000 | 20,200 | 45,000 | 29,940 |
| Unallocated Reserve | 10,000 | 0 | 5,000 | 0 | 0 | 0 |
Notes: To protect privacy, we round table cells to the nearest 10. Totals may not sum due to rounding. Ceiling and admission numbers reflect annual revisions. Data are as of February 15, 2025. The sum of 2024 allocations by region exceeded the total, which was intended to provide flexibility as needs developed, but total admissions among all regions were not to exceed 125,000.
Source: Office of Homeland Security Statistics analysis of DOS data.
Trends and Characteristics of Refugees
In 2024, the United States admitted 100,060 refugees, more than the total refugees admitted in both 2022 and 2023 combined.
Since the beginning of the U.S. Refugee Admissions Program (USRAP) in 1980, the United States has accepted more than 3 million refugees. Refugee admissions reached 122,070 in 1990 and averaged approximately 65,920 per year after 1990. Refugee admissions since 1990 have followed 4 general trends (Figure 1).
- Admissions declined during the first half of the 1990s as the program focused more on diverse populations across the world, before rising through 2001. Admissions declined again to 26,790 in 2002 due to increased security measures and restrictions after September 11, 2001.
- Refugee admissions reached a post-2001 peak of 84,990 in 2016, the highest number in 17 years.
- Following reductions in the ceiling and new refugee vetting and screening procedures, along with COVID-era travel restrictions, admissions decreased from 2017 to 2022.
- Admissions increased each year from 2022 to 2024, reaching 100,060 in 2024, the highest number since 1994
Figure 1.
Actual Refugee Admissions and Admissions Ceilings
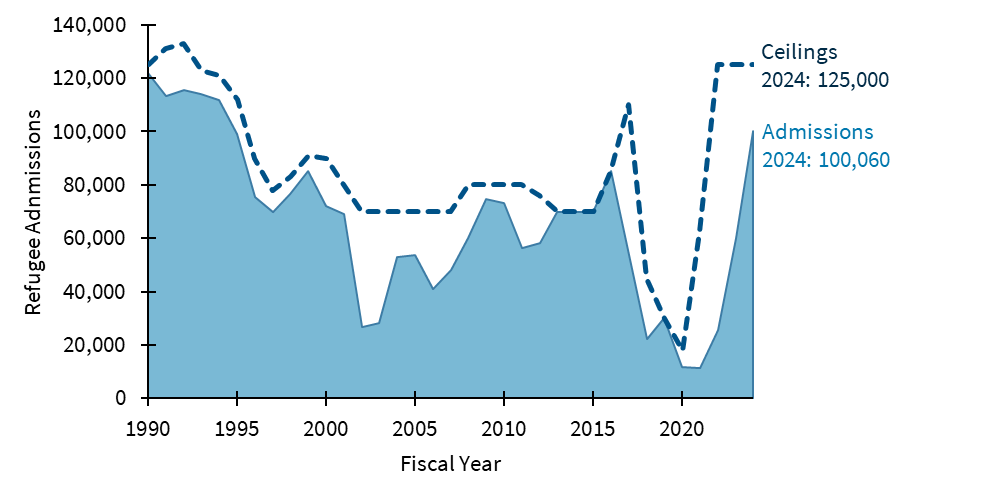
Note: Data for fiscal years 2022-2024 are as of February 15, 2025.
Source: Office of Homeland Security Statistics analysis of DOS data.
Category of Admission
Of 100,060 refugees admitted in 2024, the break down for applicant type was (Table 2a):
- Principal refugees (37%)
- Accompanying spouses (14%)
- Children (49%)
Table 2a.
Refugee Arrivals by Relationship to Principal Applicant: Fiscal Years 2022 to 2024
| Relationship to Principal Applicant | 2022 Number | 2022 Percent | 2023 Number | 2023 Percent | 2024 Number | 2024 Percent |
|---|---|---|---|---|---|---|
| Total | 25,520 | 100.0% | 60,050 | 100.0% | 100,060 | 100.0% |
| Principal applicant | 9,010 | 35.3% | 21,760 | 36.2% | 37,050 | 37.0% |
| Spouse | 3,270 | 12.8% | 7,750 | 12.9% | 14,200 | 14.2% |
| Child | 13,140 | 51.5% | 30,360 | 50.6% | 48,580 | 48.6% |
| Siblings, parents, and other dependents | 100 | 0.4% | 180 | 0.3% | 230 | 0.2% |
Notes: To protect privacy, we round table cells to the nearest 10. Totals may not sum due to rounding. Data are as of February 15, 2025.
Source: Office of Homeland Security Statistics analysis of DOS data.
Of 100,060 refugees admitted in 2024, the break down for case priorities was (Table 2b):
- Priority 1 (P-1) processing (individuals referred by the United Nations Refugee Agency (UNHCR), a U.S. Embassy, or certain non-governmental organizations (NGOs) (77%)
- Priority 2 (P-2) processing (groups of special humanitarian concern) (20%)
- Priority 3 (P-3) processing (family reunification cases) (0.7%)
- Priority 4 (P-4) processing (private sponsors through Welcome Corps program) (1.3%)
- Follow-to-join refugee beneficiaries (0.8%)
Table 2b.
Refugee Arrivals by Case Priority: Fiscal Years 2022 to 2024
| Case Priority | 2022 Number | 2022 Percent | 2023 Number | 2023 Percent | 2024 Number | 2024 Percent |
|---|---|---|---|---|---|---|
| Total | 25,520 | 100.0% | 60,050 | 100.0% | 100,060 | 100.0% |
| Priority 1 | 17,640 | 69.1% | 44,840 | 74.7% | 76,880 | 76.8% |
| Priority 2 | 7,270 | 28.5% | 14,280 | 23.8% | 20,320 | 20.3% |
| Priority 3 | 100 | 0.4% | 250 | 0.4% | 740 | 0.7% |
| Priority 4 | 0 | 0.0% | 0 | 0.0% | 1,330 | 1.3% |
| Follow-to-join beneficiaries | 510 | 2.0% | 690 | 1.1% | 800 | 0.8% |
Notes: To protect privacy, we round table cells to the nearest 10. Totals may not sum due to rounding. Data are as of February 15, 2025.
Source: Office of Homeland Security Statistics analysis of DOS data.
Country of Nationality
In 2024, the 4 leading countries of nationality for individuals admitted as refugees made up 57% of total refugee admissions (Table 3). Top nationalities in 2024 included:
- Democratic Republic of the Congo (20%)
- Afghanistan (15%)
- Venezuela (11%)
- Syria (11%)
The nationalities of refugees admitted to the United States have changed as U.S. policies have evolved and new conflicts have arisen throughout the world. Venezuelan refugees increased 71-fold from 160 in 2022 to 11,350 in 2024.
Over the last 10 years, the United States has admitted 469,830 refugees. Top nationalities included:
- Democratic Republic of the Congo (23%)
- Burma (13%)
- Syria (11%)
- Iraq (7.4%)
- Somalia (6.7%)
Table 3.
Refugee Arrivals by Country of Nationality: Fiscal Years 2022 to 2024
(Ranked by 2024 Country of Nationality)
| Country of Nationality | 2022 Number | 2022 Percent | 2023 Number | 2023 Percent | 2024 Number | 2024 Percent |
|---|---|---|---|---|---|---|
| Total | 25,520 | 100.0% | 60,050 | 100.0% | 100,060 | 100.0% |
| Congo, Democratic Republic | 7,740 | 30.3% | 18,080 | 30.1% | 19,830 | 19.8% |
| Afghanistan | 1,620 | 6.3% | 6,590 | 11.0% | 14,680 | 14.7% |
| Venezuela | 160 | 0.6% | 1,370 | 2.3% | 11,350 | 11.3% |
| Syria | 4,560 | 17.9% | 10,780 | 17.9% | 11,240 | 11.2% |
| Burma | 2,140 | 8.4% | 6,130 | 10.2% | 7,330 | 7.3% |
| Guatemala | 1,080 | 4.2% | 1,760 | 2.9% | 5,030 | 5.0% |
| Somalia | 490 | 1.9% | 1,410 | 2.4% | 4,790 | 4.8% |
| Nicaragua | 10 | 0.0% | 210 | 0.4% | 2,950 | 3.0% |
| Colombia | 250 | 1.0% | 1,160 | 1.9% | 2,520 | 2.5% |
| Eritrea | 320 | 1.2% | 970 | 1.6% | 2,400 | 2.4% |
| All other countries, including unknown | 7,140 | 28.0% | 11,600 | 19.3% | 17,920 | 17.9% |
Note: To protect privacy, we round table cells to the nearest 10. Totals may not sum due to rounding. Data are as of February 15, 2025.
Source: Office of Homeland Security Statistics analysis of DOS data.
Figure 2.
Refugee Arrivals by Top Country of Nationality: Fiscal Years 2014 to 2024
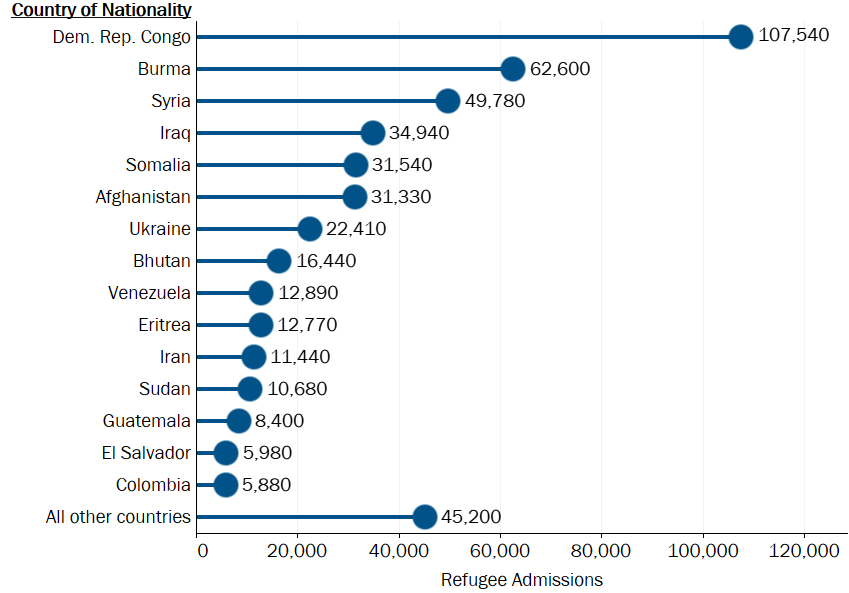
Note: Data are as of February 15, 2025. “All other countries” includes unknown.
Source: Office of Homeland Security Statistics analysis of DOS data.
Age, Sex, and Marital Status
The proportion of refugees admitted to the United States in 2024 by age (Table 4a):
- 75% were under 35 years of age
- 43% were children under 18 years of age
The median age of refugees who arrived in 2024 was 21, compared to 39 years of age for the entire U.S. population.[8] Refugee median age varied slightly by sex in 2024: female refugees had a higher median age (22) than male refugees (20). Refugee median age had considerable variation by region and country of birth. Refugees from Africa and East Asia had the lowest median ages of 19 and 20, respectively. Latin America/Caribbean had the highest median age of 26. Slightly more female than male refugees were admitted in 2024 (Table 4b). About two-thirds of refugee arrivals in 2024 were single and one-third married (Table 4c). Among adult (18 and over) arrivals in 2024, 54% were married, the same proportion as in 2023.
Table 4a.
Refugee Arrivals by Age: Fiscal Years 2022 to 2024
| Age Group | 2022 Number | 2022 Percent | 2023 Number | 2023 Percent | 2024 Number | 2024 Percent |
|---|---|---|---|---|---|---|
| Total | 25,520 | 100.0% | 60,050 | 100.0% | 100,060 | 100.0% |
| 0 to 17 years | 11,270 | 44.2% | 27,210 | 45.3% | 43,360 | 43.3% |
| 18 to 24 years | 3,480 | 13.6% | 8,120 | 13.5% | 13,290 | 13.3% |
| 25 to 34 years | 4,180 | 16.4% | 9,930 | 16.5% | 18,210 | 18.2% |
| 35 to 44 years | 3,310 | 13.0% | 7,810 | 13.0% | 13,500 | 13.5% |
| 45 to 54 years | 1,940 | 7.6% | 4,020 | 6.7% | 6,770 | 6.8% |
| 55 to 64 years | 850 | 3.3% | 1,900 | 3.2% | 3,150 | 3.2% |
| 65 years and over | 500 | 1.9% | 1,070 | 1.8% | 1,760 | 1.8% |
Notes: To protect privacy, we round table cells to the nearest 10. Totals may not sum due to rounding. Data are as of February 15, 2025.
Source: Office of Homeland Security Statistics analysis of DOS data.
Table 4b.
Refugee Arrivals by Sex: Fiscal Years 2022 to 2024
| Sex | 2022 Number | 2022 Percent | 2023 Number | 2023 Percent | 2024 Number | 2024 Percent |
|---|---|---|---|---|---|---|
| Total | 25,520 | 100.0% | 60,050 | 100.0% | 100,060 | 100.0% |
| Female | 12,700 | 49.7% | 29,800 | 49.6% | 50,410 | 50.4% |
| Male | 12,820 | 50.3% | 30,260 | 50.4% | 49,650 | 49.6% |
Notes: To protect privacy, we round table cells to the nearest 10. Totals may not sum due to rounding. Data are as of February 15, 2025.
Source: Office of Homeland Security Statistics analysis of DOS data.
Table 4c.
Refugee Arrivals by Marital Status: Fiscal Years 2022 to 2024
| Marital Status | 2022 Number | 2022 Percent | 2023 Number | 2023 Percent | 2024 Number | 2024 Percent |
|---|---|---|---|---|---|---|
| Total | 25,520 | 100.0% | 60,050 | 100.0% | 100,060 | 100.0% |
| Married | 7,750 | 30.4% | 17,690 | 29.5% | 31,810 | 31.8% |
| Never Married | 16,950 | 66.4% | 40,310 | 67.1% | 65,070 | 65.0% |
| Other | 830 | 3.2% | 2,050 | 3.4% | 3,170 | 3.2% |
Notes: For purposes of Table 4c, “Married” includes persons who claimed they were married and persons who were separated. “Never Married” includes persons who were engaged and not yet married. “Other” includes persons who were divorced, widowed, or of unknown marital status. Table is inclusive of all refugee arrivals, including children. To protect privacy, we round table cells to the nearest 10. Totals may not sum due to rounding. Data are as of February 15, 2025.
Source: Office of Homeland Security Statistics analysis of DOS data.
State of Initial Resettlement
In 2024, over half of admitted refugees (51%) were resettled within 10 states (Table 5).
The top 3 states where the most refugees resettled in 2024 were:
- Texas (9.7%)
- California (7.6%)
- New York (6.2%)
Table 5.
Refugee Arrivals by State of Residence: Fiscal Years 2022 to 2024
(Ranked by 2024 State of Residence)
| State of Residence | 2022 Number | 2022 Percent | 2023 Number | 2023 Percent | 2024 Number | 2024 Percent |
|---|---|---|---|---|---|---|
| Total | 25,520 | 100.0% | 60,050 | 100.0% | 100,060 | 100.0% |
| Texas | 2,110 | 8.3% | 5,050 | 8.4% | 9,750 | 9.7% |
| California | 2,180 | 8.6% | 3,670 | 6.1% | 7,590 | 7.6% |
| New York | 1,400 | 5.5% | 3,850 | 6.4% | 6,190 | 6.2% |
| Florida | 750 | 2.9% | 1,900 | 3.2% | 4,580 | 4.6% |
| Pennsylvania | 1,100 | 4.3% | 2,770 | 4.6% | 4,480 | 4.5% |
| Washington | 1,240 | 4.9% | 2,440 | 4.1% | 4,010 | 4.0% |
| Illinois | 910 | 3.6% | 2,330 | 3.9% | 3,800 | 3.8% |
| Arizona | 1,030 | 4.0% | 2,610 | 4.3% | 3,780 | 3.8% |
| Michigan | 1,140 | 4.5% | 2,450 | 4.1% | 3,660 | 3.7% |
| Ohio | 1,130 | 4.4% | 2,500 | 4.2% | 3,610 | 3.6% |
| Other | 12,530 | 49.1% | 30,490 | 50.8% | 48,610 | 48.6% |
Notes: To protect privacy, we round table cells to the nearest 10. Totals may not sum due to rounding. Data are as of February 15, 2025.
Source: Office of Homeland Security Statistics analysis of DOS data.
The top 3 states with the most refugees per capita in 2024 (Figure 3):[9]
- Nebraska (92 refugees per 100,000 state population)
- Iowa (86 refugees per 100,000 state population)
- Vermont (66 refugees per 100,000 state population)
Figure 3.
Per Capita Refugee Resettlement by State of Residence: Fiscal Year 2024
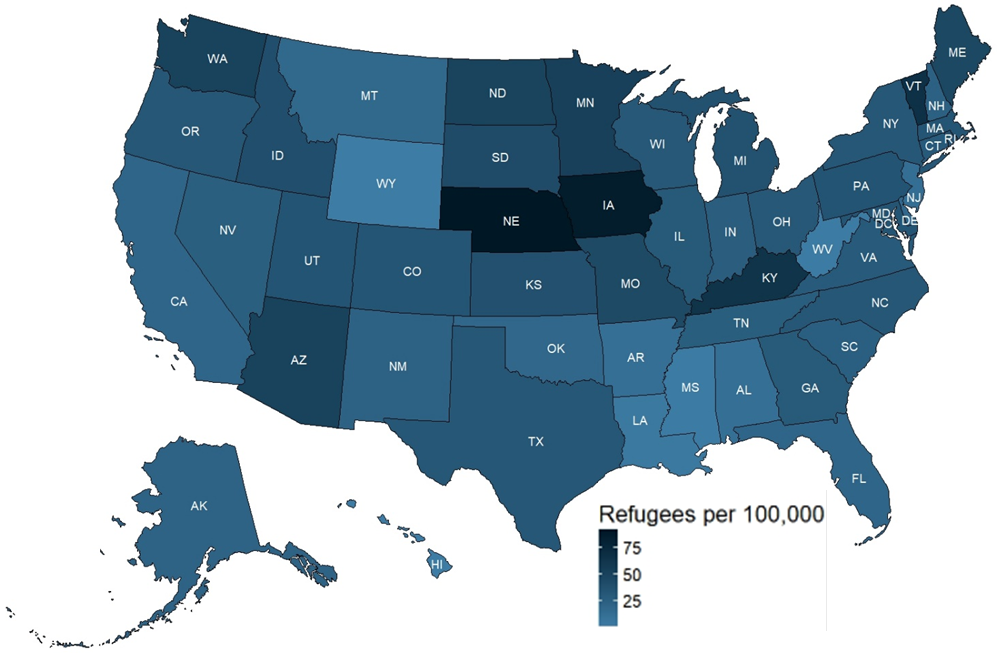
Note: Refugee data are as of February 15, 2025, state population estimates as of July 1, 2024.
Source: Office of Homeland Security Statistics analysis of Department of State and U.S. Census Bureau, Population Division data. Annual Estimates of the Resident Population for the United States, Regions, States, District of Columbia, and Puerto Rico: April 1, 2020 to July 1, 2024 (NST-EST2024-POP). Web. February 18, 2025.
From the top 10 nationalities of refugee arrivals within states of resettlement in 2024 (Table 6),
- The top 3 states of resettlement for Democratic Republic of the Congo refugees were:
- Texas (1,760)
- Kentucky (1,750)
- Ohio (1,330)
- The top 3 states of resettlement for Afghanistan refugees were:
- California (3,160)
- Texas (1,570)
- Virginia (1,260)
Table 6.
Top 10 Refugee Arrival Nationality-State of Resettlement Pairings: Fiscal Year 2024
| Nationality - State of Resettlement | Number of Refugees | Proportion of Refugees Resettling to this State Who Are of this Nationality |
|---|---|---|
| Afghanistan to California | 3,160 | 42% |
| Venezuela to Texas | 1,770 | 18% |
| Democratic Republic of the Congo to Texas | 1,760 | 18% |
| Democratic Republic of the Congo to Kentucky | 1,750 | 60% |
| Venezuela to Florida | 1,660 | 36% |
| Afghanistan to Texas | 1,570 | 16% |
| Democratic Republic of the Congo to Ohio | 1,330 | 37% |
| Democratic Republic of the Congo to New York | 1,280 | 21% |
| Democratic Republic of the Congo to Arizona | 1,270 | 34% |
| Afghanistan to Virginia | 1,260 | 50% |
Notes: To protect privacy, we round table cells to the nearest 10. Totals may not sum due to rounding. Data are as of February 15, 2025.
Source: Office of Homeland Security Statistics analysis of DOS data.
Out of 2,920 refugee arrivals that resettled in Kentucky in 2024, 1,750 (60%) of them are from the Democratic Republic of the Congo.
Lawful Permanent Residence and Naturalization of Refugees
Refugees are required to apply for lawful permanent resident (LPR), or “green card” status, 1 year after admittance to the United States. Of the approximately 768,000 adult refugees arriving between 2000 and 2022, 97% gained LPR status by the end of 2024.[10] These rates were similar across sex and age groups. More recently, of approximately 95,000 adults arriving as refugees between 2017 and 2022, 85% had gained LPR status by the end of 2024. Among adult refugees who arrived between 2017 and 2022, the proportion of refugees who became LPRs by world region as of the end of 2024 were:[11]
- Lowest from Latin America/Caribbean (74%)
- Highest from East Asia (90%)
When granted LPR status, a refugee’s “resident since” date remains the individual’s date of admission as a refugee. Refugees who have become LPRs may apply for naturalization 5 years after their “resident since” date. Refugees have some of the highest naturalization rates of all immigrants. Of the approximately 820,000 adults who obtained LPR status from 2000 to 2018 based on prior admission as a refugee, 58% naturalized within 6 years.[12] These naturalization rates within 6 years of obtaining LPR status varied slightly across sex:
- 60% of female refugees
- 56% of male refugees
The naturalization rate varied by age group, with a 6-year naturalization rate of:
- 59% for those refugees who gained LPR status between ages 18 and 34
- 52% for those who gained LPR status between ages 35 and 54
- 70% for those who became LPRs at age 55 years or older
Footnotes
- The Office of Homeland Security Statistics (OHSS) prepared this report. This report includes analysis of relevant statutes, policy, and processes to provide background and context for DHS statistical data. “Years” refer to fiscal years, which run from October 1 to September 30. Fiscal Year 2024 ran from October 1, 2023 to September 30, 2024. This report may cite numbers not contained in the tables. The 2024 Yearbook of Immigration Statistics and other OHSS reports contain additional context. To protect privacy, we round table cells and numbers in this report to the nearest 10. Totals may not sum due to rounding. ↩ Back
- Twenty individuals received derivative refugee status while living in the United States based on a relative’s refugee grant. Eight hundred individuals abroad were approved and admitted as follow-to-join refugees. Refugee data in this report may differ slightly from numbers reported by the Department of State (DOS). DOS refugee numbers include Amerasians (children born in Cambodia, Korea, Laos, Thailand, or Vietnam after December 31, 1950, and before October 22, 1982, and fathered by a U.S. citizen), whereas DHS reports these Amerasians as lawful permanent residents. ↩ Back
- Principal refugees are refugees who have applied for refugee status and have been found to meet the definition of a refugee set forth in Section 101(a)(42) of INA. ↩ Back
- Derivative refugees are eligible dependents (spouses and unmarried children under 21 years of age) of the principal refugee who either accompany the principal refugee or are petitioned for by the principal as follow-to-join derivatives. The terms derivative and dependent are therefore used interchangeably in this report. ↩ Back
- In many cases, an unallocated reserve is also designated, which can be used in any region if the need arises and only after notification to Congress. ↩ Back
- See Refugees and Asylees: 2022 for detailed discussion. ↩ Back
- People from certain, designated countries may, if otherwise qualified, be considered refugees for the purpose of admission to the United States within their countries of nationality or habitual residence. ↩ Back
- Median age U.S. population estimate from the U.S. Census Bureau’s American Community Survey (ACS), ACS 1-Year Estimates Subject Tables, Table S0101, 2023. The U.S. population is defined as usual residents within the 50 states, the District of Columbia, and Puerto Rico. U.S. Census Bureau. Understanding and Using American Community Survey Data: What All Data Users Need to Know, March 2020. ↩ Back
- State population estimates for per capita calculations from U.S. Census Bureau’s Annual Estimates of the Resident Population for the United States, Regions, States, District of Columbia, and Puerto Rico: April 1, 2020 to July 1, 2024 (NST-EST2023-POP). ↩ Back
- The cutoff year 2022 allows 1 year of waiting to be eligible for LPR status plus 1 additional year to file paperwork and undergo processing before the end of the current 2024 data; in other words, allowing a full 2 years for refugees to gain LPR status. Data were restricted to individuals who were at least 18 years of age when LPR status was obtained, indicating a choice to adjust status was made. ↩ Back
- This rate by world region is not available for those arriving prior to 2016. ↩ Back
- The cutoff year of 2018 allows for 5 years of waiting to be eligible for naturalization plus 1 additional year to file paperwork and undergo processing before the end of the current 2024 data; in other words, allowing a full 6 years for refugees to naturalize. Data were restricted to individuals who gained LPR status at age 18 or above. ↩ Back
