

Bryan Baker
August 12, 2025
As some terminology in reports do change, we maintain previously posted reports and datasets as originally approved and published.
Introduction
Nonimmigrants are aliens admitted into the United States for specific, temporary purposes. Examples of such temporary purposes include tourism, work, study, participation in a cultural exchange program, or representing a foreign government or international organization. Together with the numbers of nonimmigrant visas issued, nonimmigrant arrivals, and nonimmigrant overstays (a.k.a. “visa overstays”), the number of nonimmigrants living in the United States is important for domestic and foreign policy considerations.[1] For example, it is an essential component for estimating the total size of the U.S. population, which is necessary for apportionment, and it is required for the most widely-accepted method for estimating the size of the illegal alien population.
This report presents estimates of the size and characteristics of the population of nonimmigrants residing in the United States in fiscal years (FY) 2019 through 2024, with characteristics broken out in further detail for the population in FY 2024.[2] It focuses exclusively on nonimmigrants admitted for purposes associated with residence, such as work and study, and excludes nonimmigrants admitted for non-residential purposes, such as tourism.
In summary, 3.6 million nonimmigrants resided within the United States in FY 2024, an increase of 15% from 3.1 million in 2019, or about 3% per year on average. Most resident nonimmigrants were admitted under temporary worker or student classes of admission and comprised about 90% of the total. India and China were the biggest senders of international students, and India and Mexico were the biggest senders of temporary workers. The age and sex distributions varied by group, but overall, 80% were ages 18 to 44 and 57% were male.
The estimates are derived from matched U.S. Department of Homeland Security (DHS) administrative records of nonimmigrant arrivals and departures in U.S. Customs and Border Protection’s (CBP) Arrival and Departure Information System (ADIS). The estimation method has been updated from previous editions of this report. To account for the impact of the update, estimates for FY 2019 are provided using both the previous and updated methods throughout the report, and results are compared for individual class of admission in the Data and Method section.[3]
Note that some numbers cited in this report may be derived from, rather than contained in, the report’s tables. Numbers in the tables are rounded and may not sum to totals due to rounding. Percentages in the tables were calculated prior to rounding.
Class of Admission
A nonimmigrant’s class of admission is based on the purpose of the stay in the United States and assigned by an admissions officer during the inspection and admission process. In this report, classes of admission are grouped into categories for presentation and discussion.[4]
In summary, temporary workers comprised about 45% to 50% of the population each year from FY 2019 to 2024, about 35% were students, 8% to 10% were exchange visitors, and 4% were diplomats and other representatives (Table 1a).[5] The temporary worker population grew steadily during the period, at a rate of about 60,000 people per year. The international student population fell by nearly 20% from 2019 to 2021 due to the COVID-19 pandemic, but then grew by nearly 35% from 2021 to 2024, for a total increase of 10% from 2019 to 2024.
Table 1. Resident Nonimmigrant Population by Class of Admission: Fiscal Years 2019 to 2024
| Category of admission | 2019* | 2019 | 2020 | 2021 | 2022 | 2023 | 2024 |
|---|---|---|---|---|---|---|---|
| Total (all categories) | 3,190,000 | 3,140,000 | 3,120,000 | 2,900,000 | 3,260,000 | 3,470,000 | 3,600,000 |
| Diplomats and other representatives | 130,000 | 120,000 | 120,000 | 120,000 | 130,000 | 140,000 | 150,000 |
| Exchange visitors | 350,000 | 300,000 | 250,000 | 180,000 | 260,000 | 300,000 | 310,000 |
| Students | 1,100,000 | 1,100,000 | 1,060,000 | 910,000 | 1,120,000 | 1,180,000 | 1,220,000 |
| Temporary workers | 1,460,000 | 1,420,000 | 1,480,000 | 1,480,000 | 1,540,000 | 1,640,000 | 1,700,000 |
| All other categories | 150,000 | 200,000 | 220,000 | 210,000 | 210,000 | 210,000 | 220,000 |
* This column of estimates for 2019 uses the historical model-based method, as opposed to the updated arrival/departure, ADIS-based estimates for 2019-2024, and is presented for comparison.
Notes: Detail may not sum to total due to rounding; data include dependent family members; in subsequent tables, some of the smaller categories are further consolidated.
Source: DHS/OHSS analysis of CBP data.
Country of Citizenship
The distribution of nonimmigrants residing in the United States varies significantly by country, with certain countries having higher or lower concentrations in specific categories such as temporary workers, students, or exchange visitors. India was the largest overall sending country in FY 2024, contributing 33% of the total nonimmigrant population, and it also accounted for a substantially larger fraction of all temporary workers (47%). Nearly 70% of the Indian nonimmigrants were temporary workers and 30% were students. For all countries combined, 47% were temporary workers and 34% were students.
Mexico and China were the second largest sending countries, each contributing 11% to the total. Nearly 90% of the Mexican nonimmigrants were temporary workers and made up 22% of all nonimmigrant temporary workers. Chinese nonimmigrants were disproportionately admitted as students (71%), representing 23% of all nonimmigrant students. Colombia and the Philippines sent disproportionately large numbers of exchange visitors, with 30 to 35% of their resident nonimmigrants being exchange visitors compared to only 9% for all countries combined.
Table 2a. Resident Nonimmigrant Population by Country of Citizenship and Class of Admission: Fiscal Year 2024
| Country | Total across all categories (number) | Total across all categories (percent) | Diplomats and other representatives (percent) | Exchange visitors (percent) | Students (percent) | Temporary workers and international transferees (percent) | All other categories (percent) |
|---|---|---|---|---|---|---|---|
| Total | 3,600,000 | 100% | 100% | 100% | 100% | 100% | 100% |
| India | 1,190,000 | 33% | 3% | 8% | 29% | 47% | 1% |
| Mexico | 410,000 | 11% | 3% | 3% | 1% | 22% | 5% |
| China | 400,000 | 11% | 2% | 7% | 23% | 5% | 4% |
| Canada | 130,000 | 4% | 3% | 2% | 2% | 5% | 5% |
| Korea, South | 100,000 | 3% | 2% | 5% | 4% | 1% | 6% |
| Japan | 80,000 | 2% | 2% | 3% | 1% | 1% | 17% |
| Brazil | 80,000 | 2% | 3% | 6% | 2% | 2% | 1% |
| United Kingdom | 60,000 | 2% | 7% | 2% | 1% | 1% | 4% |
| Philippines | 60,000 | 2% | 2% | 6% | 0% | 1% | 7% |
| Colombia | 40,000 | 1% | 2% | 5% | 1% | 1% | 2% |
| All others | 1,050,000 | 29% | 71% | 54% | 35% | 14% | 48% |
Note: Detail may not sum to total due to rounding; data include dependent family members.
Source: DHS/OHSS analysis of CBP data.
Overall, the population of resident nonimmigrants increased by 14% from FY 2019 to FY 2024, about 3% per year. The population from India increased by 31%, and the populations from Colombia, Mexico, and the Philippines increased by 45 to 53%. The population from China fell by 18%; most of the decline for China occurred from 2019 to 2021 (during the COVID-19 pandemic era), after which time the population started to grow again at about the same rate as the overall nonimmigrant population.
Table 2b. Resident Nonimmigrant Population by Country of Citizenship: Fiscal Years 2019 to 2024
| Country | FY 2019* | FY 2019 | FY 2020 | FY 2021 | FY 2022 | FY 2023 | FY 2024 |
|---|---|---|---|---|---|---|---|
| Total (all countries) | 3,190,000 | 3,140,000 | 3,120,000 | 2,900,000 | 3,260,000 | 3,470,000 | 3,600,000 |
| India | 870,000 | 910,000 | 950,000 | 960,000 | 1,000,000 | 1,080,000 | 1,190,000 |
| Mexico | 280,000 | 280,000 | 300,000 | 330,000 | 390,000 | 430,000 | 410,000 |
| China, People's Republic | 450,000 | 480,000 | 480,000 | 350,000 | 430,000 | 410,000 | 400,000 |
| Canada | 200,000 | 140,000 | 120,000 | 120,000 | 120,000 | 130,000 | 130,000 |
| Korea, South | 110,000 | 100,000 | 90,000 | 80,000 | 90,000 | 100,000 | 100,000 |
| Japan | 100,000 | 90,000 | 80,000 | 70,000 | 80,000 | 80,000 | 80,000 |
| Brazil | 70,000 | 70,000 | 80,000 | 70,000 | 70,000 | 80,000 | 80,000 |
| United Kingdom | 80,000 | 70,000 | 60,000 | 60,000 | 60,000 | 60,000 | 60,000 |
| Philippines | 30,000 | 40,000 | 40,000 | 40,000 | 40,000 | 50,000 | 60,000 |
| Colombia | 30,000 | 30,000 | 30,000 | 30,000 | 40,000 | 40,000 | 40,000 |
| All others | 970,000 | 940,000 | 890,000 | 810,000 | 930,000 | 1,010,000 | 1,050,000 |
* This column of estimates for 2019 uses the historical model-based method, as opposed to the updated arrival/departure, ADIS-based estimates for 2019-2024, and is presented for comparison.
Note: Detail may not sum to total due to rounding.
Source: DHS/OHSS analysis of CBP data.
State of Destination
California was home to the most nonimmigrants, accounting for 500,000 persons or 14% of the total (Table 3; Figure 2). Forty-one percent of nonimmigrants in California were temporary workers and 34% were students, similar to the country as a whole. Texas was second, with 350,000 persons or 10% of the total. Nonimmigrants in New York, Illinois, and Massachusetts were disproportionately students (about 45% to 55%) and exchange visitors (about 10% to 15%), whereas nonimmigrants in Washington and Georgia were disproportionately workers (about 50% to 55% vs. 39% nationally). Also, nearly 20% of all foreign diplomatic staff residing in the United States resided in New York.[6] Altogether, the top five states accounted for more than 40% of all nonimmigrants residing in the United States.
Table 3a. Resident Nonimmigrant Population by State of Residence and Class of Admission: Fiscal Year 2024
| State | Total across all categories (number) | Total across all categories (percent) | Diplomats and other representatives (percent) | Exchange visitors (percent) | Students (percent) | Temporary workers and international transferees (percent) | All other categories (percent) |
|---|---|---|---|---|---|---|---|
| Total (all states) | 3,600,000 | 100% | 100% | 100% | 100% | 100% | 100% |
| California | 500,000 | 14% | 6% | 11% | 14% | 15% | 1% |
| Texas | 350,000 | 10% | 4% | 6% | 8% | 12% | 10% |
| New York | 290,000 | 8% | 19% | 10% | 11% | 5% | 2% |
| Florida | 210,000 | 6% | 4% | 6% | 5% | 6% | 4% |
| Illinois | 150,000 | 4% | 1% | 4% | 6% | 4% | 1% |
| New Jersey | 150,000 | 4% | 2% | 3% | 4% | 5% | 0% |
| Massachusetts | 140,000 | 4% | 1% | 6% | 6% | 2% | 3% |
| Washington | 120,000 | 3% | 3% | 2% | 2% | 5% | 0% |
| Georgia | 120,000 | 3% | 2% | 2% | 3% | 4% | 1% |
| North Carolina | 100,000 | 3% | 1% | 4% | 2% | 4% | 0% |
| All others and unknown | 1,460,000 | 41% | 57% | 46% | 39% | 39% | 77% |
Notes: Detail may not sum to total due to rounding; percentages are column percentages and were calculated prior to rounding; categories include dependent family members.
Source: DHS/OHSS analysis of CBP data.
Figure 1. Resident Nonimmigrant Population Distribution by Class of Admission within Each of the Top States of Residence: Fiscal Year 2024
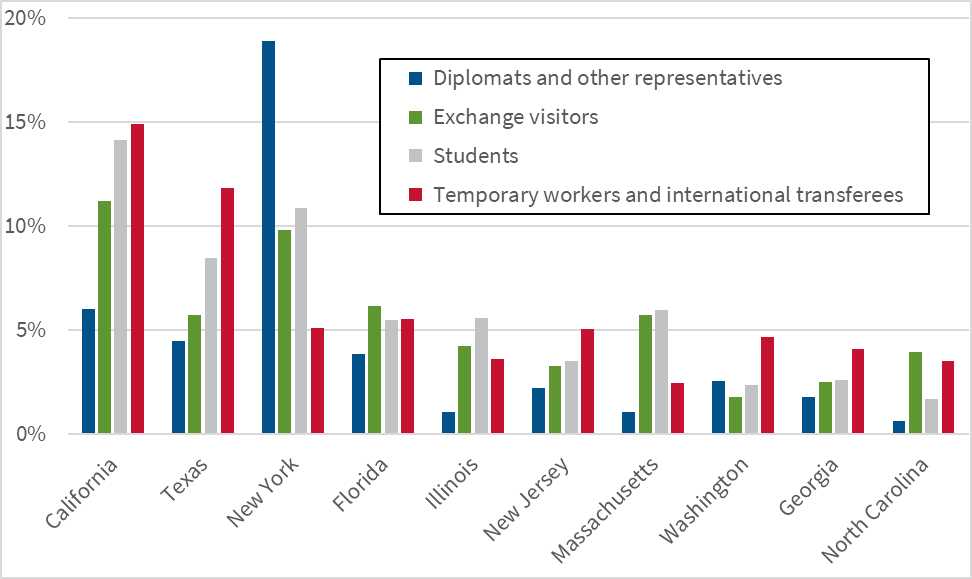
Note: Columns represent the nationwide percentage of each class of admission category residing in each state. Class of admission categories include dependent family members.
Source: U.S. Department of Homeland Security.
Among the top 20 states, the nonimmigrant population residing in Texas increased the most from FY 2019 to 2024, increasing by 40% from 240,000 in 2019 to 350,000 in 2024, most of which occurred during the FY 2021 to 2024 period. Missouri saw the largest percentage increase (45%), but that increase was relatively small, numerically (15,000 to 20,000 people). California remained the largest state of residence for nonimmigrants, hosting 14% of the total nonimmigrant population, despite having declined over the FY 2019 to 2024 period while the population in Texas grew by 40%. California was the only top-20 state with a nonimmigrant resident population size that declined during the period, but that decline was not large (3%).
Table 3b. Resident Nonimmigrant Population by State of Residence: Fiscal Years 2019 to 2024
| State | 2019* | 2019 | 2020 | 2021 | 2022 | 2023 | 2024 |
|---|---|---|---|---|---|---|---|
| Total | 3,190,000 | 3,140,000 | 3,120,000 | 2,900,000 | 3,260,000 | 3,470,000 | 3,600,000 |
| California | 560,000 | 520,000 | 520,000 | 460,000 | 500,000 | 510,000 | 500,000 |
| Texas | 250,000 | 240,000 | 250,000 | 240,000 | 270,000 | 310,000 | 350,000 |
| New York | 390,000 | 290,000 | 280,000 | 240,000 | 270,000 | 290,000 | 290,000 |
| Florida | 190,000 | 180,000 | 180,000 | 170,000 | 200,000 | 210,000 | 210,000 |
| Illinois | 140,000 | 130,000 | 120,000 | 120,000 | 130,000 | 140,000 | 150,000 |
| New Jersey | 140,000 | 130,000 | 140,000 | 130,000 | 140,000 | 140,000 | 150,000 |
| Massachusetts | 160,000 | 120,000 | 120,000 | 110,000 | 130,000 | 140,000 | 140,000 |
| Washington | 130,000 | 110,000 | 110,000 | 110,000 | 120,000 | 120,000 | 120,000 |
| Georgia | 90,000 | 100,000 | 100,000 | 100,000 | 110,000 | 120,000 | 120,000 |
| North Carolina | 70,000 | 80,000 | 80,000 | 80,000 | 90,000 | 90,000 | 100,000 |
| Pennsylvania | 100,000 | 90,000 | 80,000 | 80,000 | 90,000 | 90,000 | 100,000 |
| Michigan | 100,000 | 80,000 | 80,000 | 80,000 | 90,000 | 90,000 | 90,000 |
| Virginia | 80,000 | 80,000 | 80,000 | 80,000 | 80,000 | 80,000 | 90,000 |
| Ohio | 70,000 | 70,000 | 60,000 | 60,000 | 70,000 | 70,000 | 80,000 |
| Maryland | 50,000 | 50,000 | 50,000 | 50,000 | 60,000 | 60,000 | 60,000 |
| Arizona | 50,000 | 40,000 | 40,000 | 40,000 | 50,000 | 50,000 | 60,000 |
| District of Columbia | 50,000 | 40,000 | 40,000 | 30,000 | 40,000 | 50,000 | 50,000 |
| Missouri | 30,000 | 30,000 | 30,000 | 30,000 | 30,000 | 40,000 | 40,000 |
| Colorado | 40,000 | 40,000 | 40,000 | 30,000 | 40,000 | 40,000 | 40,000 |
| Indiana | 40,000 | 40,000 | 40,000 | 30,000 | 40,000 | 40,000 | 40,000 |
| Other or unknown | 460,000 | 690,000 | 670,000 | 630,000 | 720,000 | 790,000 | 820,000 |
* This column of estimates for 2019 uses the historical model-based method, as opposed to the updated arrival/departure, ADIS-based estimates for 2019-2024, and is presented for comparison.
Note: Detail may not sum to total due to rounding.
Source: DHS/OHSS analysis of CBP data.
Age and Sex
About 80% of the nonimmigrant population in 2024 were 18 to 44 years old, 11% were minors, and 2% were over 55 (Table 4). Temporary workers (and their accompanying family members) tended to be 25 to 44 (about 70%) and only 5% were 18 to 24 (Figure 3). Students tended to be younger, with nearly 90% ages 18 to 35. Similar to the student category, nearly 70% of exchange visitors were also 18 to 35. Diplomats and other representatives tended to be older, with 65% ages 25 to 54 and 13% 55 or older. Thus, although diplomats account for only 4% of resident nonimmigrants in total, they account for more than 25% of the 55 and older subpopulation.
Table 4a. Resident Nonimmigrant Population by Age Group and Class of Admission: Fiscal Year 2024
| Age group | Total across all categories (number) | Total across all categories (percent) | Diplomats and other representatives (percent) | Exchange visitors (percent) | Students (percent) | Temporary workers and international transferees (percent) | All other categories (percent) |
|---|---|---|---|---|---|---|---|
| Total (all ages) | 3,600,000 | 100% | 100% | 100% | 100% | 100% | 100% |
| 0-17 | 390,000 | 11% | 14% | 13% | 5% | 14% | 19% |
| 18-24 | 700,000 | 19% | 6% | 29% | 42% | 5% | 5% |
| 25-34 | 1,400,000 | 39% | 19% | 40% | 46% | 37% | 25% |
| 35-44 | 810,000 | 23% | 28% | 15% | 7% | 34% | 28% |
| 45-54 | 230,000 | 6% | 21% | 3% | 1% | 8% | 16% |
| 55+ | 70,000 | 2% | 13% | 1% | 0% | 2% | 7% |
Notes: Detail may not sum to total due to rounding; percentages are column percentages and were calculated prior to rounding; categories include dependent family members.
Source: DHS/OHSS analysis of CBP data.
Figure 2a. Resident Nonimmigrant Population by Class of Admission and Age Group: Fiscal Year 2024
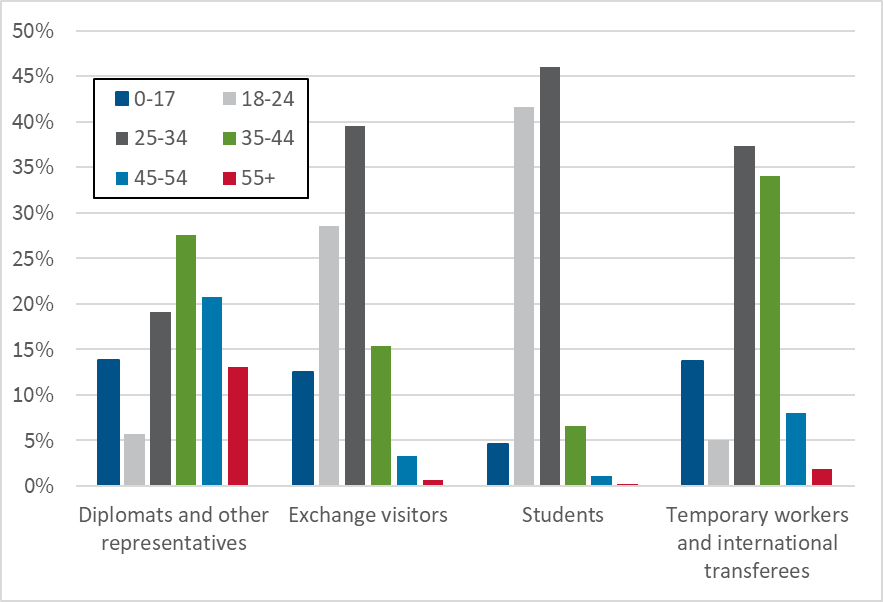
Note: Categories include dependent family members.
Source: DHS/OHSS analysis of CBP data.
Most of the resident nonimmigrant population were male (57%), but the proportion varied substantially between admission categories (Figure 4). The temporary worker and diplomatic categories were heavily male-dominated with 61% and 62% male, respectively. Students were less unevenly distributed with 56% male. Most exchange visitors on the other hand were female (58%).
Table 4b. Resident Nonimmigrant Population by Sex and Class of Admission: Fiscal Year 2024
| Sex | Total across all categories (number) | Total across all categories (percent) | Diplomats and other representatives (percent) | Exchange visitors (percent) | Students (percent) | Temporary workers and international transferees (percent) | All other categories (percent) |
|---|---|---|---|---|---|---|---|
| Total (all) | 3,600,000 | 100% | 100% | 100% | 100% | 100% | 100% |
| Female | 1,540,000 | 43% | 38% | 58% | 44% | 39% | 50% |
| Male | 2,050,000 | 57% | 62% | 42% | 56% | 61% | 50% |
Notes: Detail may not sum to total due to rounding; percentages are column percentages and were calculated prior to rounding; categories include dependent family members; estimates for “other/unknown sex” rounded to zero and are not shown.
Source: DHS/OHSS analysis of CBP data.
Figure 2b. Resident Nonimmigrant Population by Class of Admission and Sex:
Fiscal Year 2024
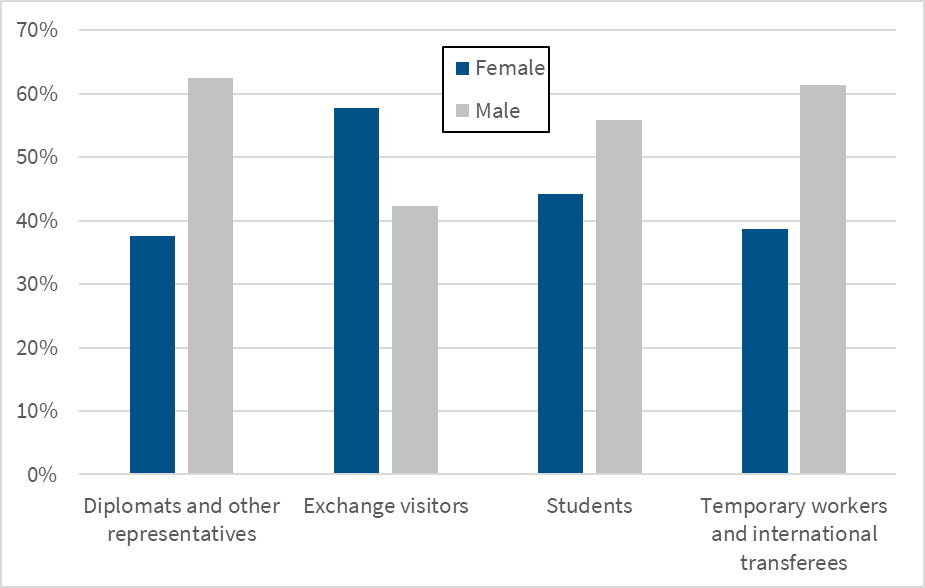
Notes: Class of admission categories include dependent family members; estimates for “other/unknown sex” rounded to zero and are not shown.
Source: DHS/OHSS analysis of CBP data.
The 35 and older age groups grew by an average of 8% during the period and did not substantially decline during the COVID-19 pandemic. The 18 to 24 age group, however, fell by 37% (270,000 people) from 2019 to 2021, before increasing by 55% from 2021 to 2024. The decline from 2019 to 2021 for the 18- to 24-year-olds was even more substantial than the 18% decline for students (195,000 people). The percentage of the population that was male was about 57% throughout the entire period.
| Age group | 2019* | 2019 | 2020 | 2021 | 2022 | 2023 | 2024 |
|---|---|---|---|---|---|---|---|
| Total (all ages) | 3,190,000 | 3,140,000 | 3,120,000 | 2,900,000 | 3,260,000 | 3,470,000 | 3,600,000 |
| 0-17 | 320,000 | 360,000 | 360,000 | 310,000 | 340,000 | 370,000 | 390,000 |
| 18-24 | 860,000 | 720,000 | 620,000 | 450,000 | 640,000 | 690,000 | 700,000 |
| 25-34 | 1,180,000 | 1,260,000 | 1,270,000 | 1,210,000 | 1,290,000 | 1,370,000 | 1,400,000 |
| 35-44 | 550,000 | 590,000 | 650,000 | 690,000 | 730,000 | 760,000 | 810,000 |
| 45-54 | 200,000 | 160,000 | 170,000 | 180,000 | 200,000 | 210,000 | 230,000 |
| 55+ | 80,000 | 50,000 | 50,000 | 50,000 | 60,000 | 70,000 | 70,000 |
* This column of estimates for 2019 uses the historical model-based method, as opposed to the updated arrival/departure, ADIS-based estimates for 2019-2024, and is presented for comparison.
Note: Detail may not sum to total due to rounding.
Source: DHS/OHSS analysis of CBP data.
Table 4d. Estimated Resident Nonimmigrant Population by Sex: Fiscal Years 2019 to 2024
| Sex | 2019* | 2019 | 2020 | 2021 | 2022 | 2023 | 2024 |
|---|---|---|---|---|---|---|---|
| Total (all) | 3,190,000 | 3,140,000 | 3,120,000 | 2,900,000 | 3,260,000 | 3,470,000 | 3,600,000 |
| Female | 1,360,000 | 1,360,000 | 1,360,000 | 1,240,000 | 1,390,000 | 1,480,000 | 1,540,000 |
| Male | 1,830,000 | 1,770,000 | 1,760,000 | 1,650,000 | 1,860,000 | 1,990,000 | 2,050,000 |
* This column of estimates for 2019 uses the historical model-based method, as opposed to the updated arrival/departure, ADIS-based estimates for 2019-2024, and is presented for comparison.
Note: Detail may not sum to total due to rounding; estimates for “other/unknown sex” rounded to zero and are not shown.
Source: DHS/OHSS analysis of CBP data.
Nonimmigrant Classes of Admission Associated with Residence
Nonimmigrant classes of admission are associated with residence if nonimmigrants admitted under those classes tend to stay 2 months or longer. Such nonimmigrants are likely to have a temporary mailing address and to be considered “resident” by the Census Bureau for the American Community Survey. The following list provides details on how nonimmigrant classes of admission associated with residence are grouped into similar categories in this report.
- Diplomats and other representatives
- A1 – Ambassadors, public ministers, career diplomatic or consular officers and their families
- A2 – Other foreign government officials or employees and immediate family
- A3 – Attendants, servants, or personal employees of A1 and A2 and immediate family
- G1 – Principals of recognized foreign governments and immediate family
- G2 – Other representatives of recognized foreign governments and immediate family
- G3 – Representatives of non-recognized or nonmember foreign governments and immediate family
- G4 – International organization officers or employees and immediate family
- G5 – Attendants, servants, or personal employees of representatives and immediate family
- N1 to N7 – North Atlantic Treaty Organization (NATO) officials, immediate family, and dependents
- Exchange visitors
- J1 – Exchange visitors
- J2 – Spouses and children of J1
- Q1 – Participants in international cultural exchange programs
- Students
- F1 – Academic students
- F2 – Spouses and children of F1
- M1 – Vocational students
- M2 – Spouses and children of M1
- Temporary Workers, intracompany transferees, and trainees
- Intracompany transferees and trainees
- L1 – Intracompany transferees
- L2 – Spouses and children of L1
- Temporary Workers
- E3 – Australian Free Trade Agreement principals, spouses and children
- H1B – Workers in specialty occupations
- H1B1 – Workers in specialty occupations (Chile and Singapore Free Trade Agreement)
- H1C – Registered nurses participating in the Nursing Relief for Disadvantaged Areas
- H2A – Temporary agricultural workers
- H2B – Temporary non-agricultural workers
- H2R – Returning H2B workers
- H3 – Trainees and participants in a special educational exchange program
- H4 – Spouses and children of H1, H2, or H3
- I1 – Representatives of foreign information media and spouses and children
- O1 – Workers with extraordinary ability or achievement
- O2 – Workers accompanying and assisting in performance of O1 workers
- O3 – Spouses and children of O1 and O2
- P1 – Internationally recognized athletes or entertainers and their essential support personnel
- P2 – Artists or entertainers in reciprocal exchange programs and their essential support personnel
- P3 – Artists or entertainers in culturally unique programs and their essential support personnel
- P4 – Spouses and children of P1, P2, or P3
- R1 – Workers in religious vocations or occupations
- R2 – Spouses and children of R1
- TN – North American Free Trade Agreement (NAFTA) professional workers
- TD – Spouses and children of TN
- Intracompany transferees and trainees
- All other categories
- Treaty traders and investors
- E1 – Treaty traders and their spouses and children
- E2 – Treaty investors and their spouses and children
- Alien fiancés/fiancées of U.S. citizens
- K1 – fiancé/fiancée of U.S. citizens
- K2 – Children of K1
- Legal Immigration Family Equity (LIFE) Act
- K3 – Spouses of U.S. citizens, visa pending
- K4 – Children of U.S. citizens, visa pending
- V1 – Spouses of permanent residents, visa pending
- V2 – Children of permanent residents, visa pending
- V3 – Dependents of V1 or V2, visa pending
Notes: The classes of admission listed above include additional variations present in ADIS (e.g., E3 includes E3D, dependent of an E3); organization into categories may be slightly different from other DHS publications.
Data and Method
The data consist of primarily of CBP information on nonimmigrant arrivals and departures, supplemented with immigration benefit status updates from other agencies, including ICE and USCIS. Commercial air carriers provide arrival and departure information to CBP via flight manifests, the Canadian Border Services Agency provides information on land departures from the United States into Canada, the CBP Office of Field Operations (OFO) provides information on admissions, ICE and USCIS provide information on status changes and extensions, student enrollments and educational program completions. All of this information is aggregated and matched together at the person level in CBP’s Arrival and Departure Information System (ADIS).
The ADIS data were queried for all persons who arrived with a resident nonimmigrant class of admission during or after FY 2015 and, at specified points in time, were within their authorized period of stay, had not departed, and had not adjusted to LPR status. These four requirements define the resident population, save for the relatively small number of people who most recently arrived before FY 2015, but who otherwise meet the requirements. The populations were queried for the 15th of each month from 2019 through 2024. The populations for each of the study years, 2019-2024, were estimated as the averages of each of the 12-month periods comprising those years. These averages represent the average population size over the course of the year for each of the study years.
Earlier editions of this report estimated the size of the resident nonimmigrant population based on observed visit lengths for resident nonimmigrants who had departed in the previous year and whose departure record was successfully matched back to a prior arrival record. Modeling was necessary because, historically, arrival and departure records were paper, hand-written by the nonimmigrant, and difficult to match. Further, the paper departure records were not reliably collected for air travelers and generally weren’t collected at all for land travelers. Directly measuring population stocks using only arrival and departure records would have resulted in overcounting the population by a growing amount each year due to the continuing accumulation of missing and unmatchable departure records. Modeling allowed for estimation of the entire population, regardless of travel mode, but was dependent on the assumptions that 1) visit lengths for nonimmigrants with similar characteristics who departed in the most recent year were representative of visit lengths for other nonimmigrants with the same characteristics who arrived during a substantially longer period; and, to a lesser extent, 2) visit lengths for otherwise-similar nonimmigrants were identical for air vs. land travelers. Although the older, model-based estimate yielded very similar results for 2019, the newer method is preferred for several reasons: it makes fuller use of available data, it’s much more robust against sudden changes in travel patterns, and it's much less computationally intensive.
DHS previously intended to begin transitioning to ADIS for nonimmigrant population estimates once data quality, completeness, and reliability had been satisfactory for a period of years. At that point, the plan was to generate the estimates using the historical method and using ADIS simultaneously, and to gauge the consistency or endeavor to explain any differences between the two sets of estimates. DHS chose a time period of ten years for the coverage window because that large of a window would fully include most nonimmigrant classes of admission and largely capture any others (e.g., H-1B workers, who can stay for six years with an extension, and even longer under certain conditions), and because the gains from waiting longer would already be marginal and declining with a window of such breadth. The first year CBP considered to have sufficient quality and completeness was 2015, which would have made 2025 the first estimation year covering at least ten full years of nonimmigrant arrivals. Unfortunately, travel behavior changed suddenly and extremely during the COVID-19 pandemic in 2020 and 2021, rendering the historical visit-length modeling method obsolete. Due to the early termination of the historical method and early implementation of the new method, we show and compare results for 2019, the most recent year for which the historical method was in effect, instead of the planned comparison for 2025 (Table 5).
Analysis was restricted to resident nonimmigrant classes of admission, i.e., classes of admission for which visits tend to last two months or longer. The 2-month duration was chosen in order to be consistent with the residence definitions used in the U.S. Census Bureau’s American Community Survey and DHS estimates of the size and characteristics of the illegal alien population (Baker and Warren, 2024).
Limitations
The new method makes fuller use of existing data and measures the size of the nonimmigrant population more directly, but it does not resolve all the shortcomings of the historical method, and it has its own limitations.
Undercount due to limited coverage window:
The ADIS-generated estimates are undercounts to the extent that some nonimmigrants present during the estimation period had most recently arrived before 2015 and were therefore absent from the coverage window. For example, an H-1B worker who arrived in 2014 and extended his or her stay for an additional three years in 2017 could have still been present in valid status in 2019 without having departed since his or her arrival in 2014. Such long visits are not the norm; in fact, prior analysis showed that most H-1B workers travel abroad once or twice a year and tend to be present in the United States for 6 to 8 months at a time between trips. Further, as the size of the coverage window increases, the number of individuals missing from that window should approach zero. Based on a comparison of estimates based on the old vs. new methods, the undercount was probably small for 2019 (see the comparison and discussion in Appendix IV); any remaining undercount due to the limited coverage window should be negligible for 2024 and beyond.[7]
Overcount due to the absence of complete and reliable generation of departure records for nonimmigrants departing by land into Mexico:
Nonimmigrants are overcounted to the extent that departures are unrecorded or otherwise not matched back to the prior arrival. This type of overcount is mitigated by the authorized period of stay; when the authorized period expires, an individual is no longer a lawful nonimmigrant and no longer counted toward the nonimmigrant population, regardless of presence or departure.[8] Missing or unmatched departures are mostly an issue unique to the southwest land border with Mexico, and the mitigated overcount probably mostly applies to Mexicans and seasonal workers regardless of country of citizenship.
Potential for delayed updates to class of admission or adjustment to LPR status:
Some nonimmigrants change from one nonimmigrant class to another or adjust to LPR status, but ADIS was designed for operational purposes and does not track when the change or adjustment occurred, only what the current status is at the time of the inquiry. In this report, changes and adjustments are not taken into account until the nonimmigrant departs and is subsequently readmitted with the new class or LPR status; nonimmigrants who adjust to LPR status continue to be counted as nonimmigrants until they make a trip outside the United States or their nonimmigrant status expires, whichever occurs first.
Impact of Method Update on Selected Classes of Admission
The 2019 estimates based on the historical and updated methods were very similar for some classes of admission, but there were also some noteworthy differences (Table AIV-3). Estimates from the two methods were nearly identical to each other for academic students (F-1) and their dependents (F-2), and very similar to each other for H-1B specialty occupation workers, H-2A seasonal agricultural workers, H-2B seasonal non-agricultural workers, and H-4 dependents of H-1B, H-2A, and H-2B. On the other hand, there were larger differences for J-1 exchange visitors, L-1 intracompany transferees, and TN NAFTA workers. For L-1 and TN workers, the new ADIS-based estimates could be underestimates due to the limited study window (see the Limitations section), or the previous, model-based estimates may have been overestimates due to the problematic capture of land departure data. Canadian entry data for Canadian citizens first became available in 2019, so the model-based estimates would have been disproportionately based on air travelers. Therefore, assuming land travelers tend to have shorter visits than air travelers, the older method would tend to overestimate the population for Canadians. Both methods are subject to this limitation for Mexicans due to the absence of data on departures by land into Mexico. The difference in the two sets of estimates for J-1 visitors remains unexplained.
Table 5: Comparison of 2019 Estimates from the Historical vs. Updated Method by Class of Admission for Selected Classes
| Class | Model-based | ADIS-based |
|---|---|---|
| Total (all classes) | 3,190,000 | 3,070,000 |
| E2 | 110,000 | 100,000 |
| F1 | 1,030,000 | 1,030,000 |
| F2 | 60,000 | 60,000 |
| H1B | 430,000 | 440,000 |
| H2A | 150,000 | 160,000 |
| H2B | 80,000 | 70,000 |
| H4 | 280,000 | 290,000 |
| J1 | 290,000 | 250,000 |
| J2 | 50,000 | 50,000 |
| L1 | 170,000 | 140,000 |
| L2 | 180,000 | 170,000 |
| TN | 70,000 | 50,000 |
| All others | 290,000 | 260,000 |
Notes: Detail may not sum to total due to rounding; estimates are only shown for classes with estimated populations of at least 50,000 persons; the estimates for “Total” and “All others” exclude classes that were not included in the historical series (specifically, K1-K4 and V1-V3).
Source: DHS/OHSS analysis of CBP data.
Other Sources of Data on Students and Exchange Visitors
U.S. Immigration and Customs Enforcement (ICE) and the Institute of International Education (IIE) also count or estimate the number of foreign students studying in the United States, but with key differences. ICE counts F-1 (academic) and M-1 (vocational) students, and separately J-1 exchange visitors, listed as “active” in the ICE Student and Exchange Visitor Information System (SEVIS) at any point during the given calendar year. IIE estimates combined F-1 and J-1 enrollments at accredited institutions of higher education or in optional practical training after completing a degree program, by academic year. These counts of active students or enrollments provide important information on program participation, but can not be directly translated into counts of the number of foreign students or exchange visitors living in the United States at a given point in time or the average number during the course of the year.
In its SEVIS by the Numbers report series, ICE reported that there were about 1.5 million “active students (F-1 and M-1 visas) in both calendar year (CY) 2019 and 2023.[9] As the student numbers reported by ICE are substantially larger than the population estimates reported here, it is important to note that the numbers reported by ICE are counts of all F-1 and M-1 nonimmigrants with “active” student status at any point during the year, which is different from the average size of the student population residing in the United States during that year. For example, a count of students who were active in CY 2019 would include 2019 May graduates, 2019 incoming freshmen, summer-study and other short-term students, and students who traveled abroad for the summer or for winter break; an average population size accounts for students residing outside of the United States for part of the year. While numerically very different, an “active” student count of 1.5 million and an average population size of 1.0 or 1.1 million are consistent.
The SEVIS data on J-1 exchange visitors are maintained by the Department of State and reported by ICE. The 2023 edition of ICE’s SEVIS by the Numbers report did not include the usual J-1 exchange visitor statistic, typically a bullet or sentence with a top-line count. Previous editions of the SEVIS report gave the following counts: 520,000-535,000 for CY 2019 and 2020; 240,000-280,000 for CY 2021-2022. The timing of the fall-off coincided with the COVID-19 pandemic era, and the reduction was roughly proportional to the reduction reflected in the ADIS data (Table 1), though perhaps somewhat heavier. Monthly population counts from ADIS (Figure 3) for 2019, 2023, and 2024 illustrate a remarkably consistent monthly trend and suggest the J-1 population had fully recovered from the pandemic-era fall-off by January 2023. The monthly estimates for 2023 and 2024 mirror those from 2019, from the summertime peak to the fall semester fall-off, to the stability from then until the end of the following spring semester. The SEVIS active J-1 counts will likely reflect a proportional recovery if ICE resumes J-1 reporting.
Figure 3: Monthly Population Estimates for J-1 Exchange Visitors: Calendar Years 2019, 2023, and 2024 (through September)
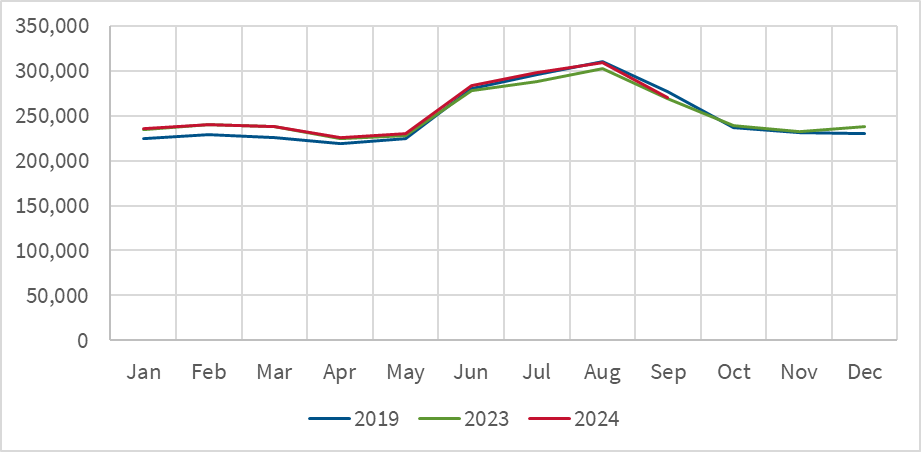
Source: DHS/OHSS analysis of CBP data.
The numbers reported by IIE[10] are survey estimates of academic enrollments at accredited institutions of higher learning by nonimmigrants with academic student (F) or exchange visitor (J) visas.[11] The IIE enrollment counts are expected to exceed DHS student population estimates because an enrolled student may be outside the United States for most or part of the year and because DHS does not include exchange visitors in its student estimates.[12] Further, not all exchange visitors are students, so a clear comparison is not possible. IIE reported about 1.08 million enrollments in the 2019/2020 academic year,[13] compared to a DHS population estimate of 1.04 million students and about 1.29 million F-1 and M-1 students and J-1 exchange visitors, combined, in FY2019.
References
Bryan Baker, and Warren, Robert, 2024. “Estimates of the Unauthorized Immigrant Residing in the United States: January 2018-January 2022,” Office of Homeland Security Statistics; Office of Strategy, Policy, and Plans; U.S. Department of Homeland Security.
Institute of International Education, 2024. “International Student and U.S. Higher Education Enrollment, 1948/49 – 2023/24” Open Doors Report on International Educational Exchange. Retrieved from https://opendoorsdata.org/.
U.S. Department of Homeland Security. “Entry and Exit Overstay Report”, annual report series, Customs and Border Protection, U.S. Department of Homeland Security.
U.S. Department of Homeland Security, web publication. “SEVIS by the Numbers, Annual Report on International Student Trends”, calendar year 2019, 2022, and 2023 editions, Student and Exchange Visitor Program, Immigration and Customs Enforcement, U.S. Department of Homeland Security.
Footnotes
- Instead applying for a nonimmigrant visa with the U.S. Department of State, some travelers from countries participating in the Visa Waiver Program may apply for travel authorization through DHS online, using the Electronic System for Travel Authorization. ↩ Back
- Hereafter, “year” will refer to the fiscal year unless otherwise specified. Fiscal year 2024 ran from Oct. 1, 2023 to September 30,2024. ↩ Back
- Previous editions of this report used statistical models of nonimmigrant visit lengths and information on arrival flows to estimate the size and characteristics of the nonimmigrant population because matched arrival and departure data were not complete or mature enough to accurately measure the population. See the Data and Method section for details. ↩ Back
- The categories in this report are similar, but not identical, to those historically reported in the OHSS nonimmigrant flow report series and the OHSS Yearbook of Immigration Statistics. ↩ Back
- Family members and support personnel whose status is derived from a principal nonimmigrant such as an artist, entertainer, or foreign government official are counted as part of the principal nonimmigrant’s class of admission category. ↩ Back
- Another 15% resided in Washington, D.C. (not shown). ↩ Back
- The historical method had a similar limitation, in that it only considered nonimmigrants who had arrived in the ten-year period preceding the estimate. ↩ Back
- Nonimmigrants who stay beyond their authorized period of stay without authorization are “nonimmigrant overstayers,” also referred to as, “visa overstayers.” Certain protections from deportation or repatriation may continue or extend valid nonimmigrant status, but do not reestablish such status if awarded after the valid nonimmigrant status expired and the overstay occurred. For additional information on nonimmigrant overstayers, see the CBP Entry/Exit Overstay Report series. ↩ Back
- See the 2019 to 2023 editions of the SEVIS by the Numbers report, which can be found at the SEVIS by the Numbers section of https://www.ice.gov/sevis/whats-new. ↩ Back
- See the IIE Open Doors web publication: https://www.iie.org/Research-and-Insights/Open-Doors. ↩ Back
- The IIE estimates also include persons engaged in optional practical training (OPT). ↩ Back
- DHS student estimates include some types of students that IIE estimates do not (vocational students and secondary school students), but the numbers are very small in comparison. ↩ Back
- Including about 225,000 former students engaged in OPT. ↩ Back
